Voting
Xinyu Zhang / May 2024 (2945 Words, 17 Minutes)
Comparison of Different Voting Algorithms
Click here to view the PDF version
The code related to the analyses and results presented in this paper is available online. You can access it at this colab notebook.
Introduction
In the field of voting or social choice, a variety of options, such as political candidates or possible actions, are presented. A group — whether a nation or an organization — must to make a decision, no matter it’s a winner, a set, or a ranking. This process is guided by the preferences of the participants, who each submit a ranking of the options. The challenge lies in the selected social choice rule or mechanism, which determines the winner based on these rankings.
Numerous social choice rules have been proposed over time, leading to a comprehensive area of study concentrated on comparing these rules and determining their effectiveness. Historically, this analysis has been rooted in the formulation of axioms, dating back to the correspondence between Borda and Condorcet12, that a social choice rule should satisfy. The effectiveness of a rule can then be assessed by its adherence to these axioms.
Historically, the study of voting methods has included several classic algorithms, each known for their unique strengths and weaknesses. Among the most traditional approaches are the Plurality method and the Borda count. In the Plurality method, the candidate with the most first-place votes wins. In the Borda count, candidates are scored based on their ranks in each voter’s list. Although both methods are easy to understand and implement, they require a significant time commitment and computational resources to calculate the winner.
From the paper “Communication, Distortion, and Randomness in Metric Voting”3, when we discuss voting methods, it is essential to consider three critical properties to evaluate the effectiveness of a voting mechanism:
-
Low Distortion: This property refers to the mechanism’s ability to select a winner that closely represents the optimum candidate, minimizing the total dissatisfaction - we defined it as the distance - among voters. Low distortion is crucial for ensuring that the outcome of the voting process aligns well with the true preferences of the voters.
-
Low Communication: This involves minimizing the amount of information that voters need to communicate about their preferences. Voting mechanisms that require less communication are generally easier to implement and less burdensome on voters, making them more practical for large-scale or frequent applications.
-
Determinism: A deterministic mechanism always produces the same output when given the same input, providing predictability and stability in the voting process. While randomness can sometimes help in achieving fairness or lowering distortion, deterministic rules are often preferred for their transparency and reliability.
Random Dictatorship satisfies the properties of low communication complexity and low distortion, while basic algorithms such as Plurality and Borda satisfy the properties of low communication complexity and determinism.
This paper primarily focuses on the analysis of distortion in various randomized voting methods and explores the underlying reasons for the differences in their performance.
Notation
Problem Setup
There are some voters and some candidates. Each voter ranks the candidates in an order of preference. The goal is to select a winner from the candidates. We assume that the voters’ preferences are strict, i.e., no two candidates are ranked equally by a voter. To simplify analysis, we assume that each voter nominates top 3 candidates. The primary goal of the voting mechanism is to select a single winner from among the candidates based on the aggregated preferences of all voters.
Distortion
Assume that all voters and candidates are embedded in a pseudo-metric space $d$. $d(v, x)$ denotes the distance between voter $v$ and candidate $x$. Being a pseudo-metric, it satisfies non-negativity and the triangle inequality $d(v, x) \leq d(v, y) + d(v’, y) + d(v’, x)$ for all voters $v, v’$ and candidates $x, y$.
A vote profile $P$ is consistent with the metric $d$, and write $d \sim P$, if $\pi_v(x) < \pi_v(y)$ whenever $d(v, x) < d(v, y)$. That is, $P$ is consistent with $d$ iff all voters rank candidates by non-decreasing distance from themselves.
The cost of candidate $x$ is $C(x) = \sum_v d(v, x)$, i.e., the sum of distances of $x$ to all voters. An optimum candidate is any candidate $x^*d \in argmin{x \in X} C(x)$.
The social choice rule is handicapped by not knowing the metric $d$, instead only observing the consistent vote profile $P$. Due to this handicap, and possibly other suboptimal choices, it will typically choose candidates with higher cost than $C(x^)$. The distortion of $f$ is the worst-case ratio between the cost of the candidate chosen by $f$, and the optimal candidate $x^_d$ (determined with knowledge of the actual distances $d$). Formally,
\[\rho(f) = \max_P \sup_{d: d \sim P} \frac{C(f(P))}{C(x^*_d)}.\]Example
Consider a scenario with 50 voters and 5 candidates randomly placed in a metric space.
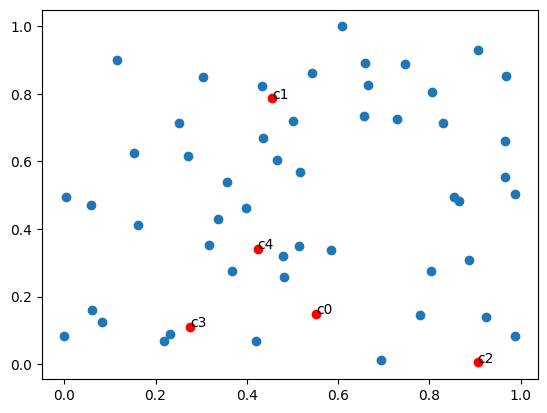 Figure 1: Sample distribution of 50 voters and 5 candidates
Next, we collect voting results using non-random voting mechanisms and compute the total distance and distortion for each candidate.
| Candidate | Total Distance | Distortion |
|---|---|---|
| c0 | 25.132589 | 2.066350 |
| c1 | 22.408661 | 1.842394 |
| c2 | 35.185664 | 2.892894 |
| c3 | 28.175204 | 2.316508 |
| c4 | 20.537130 | 1.688521 |
Table 1: Summary of Candidates’ Distortions
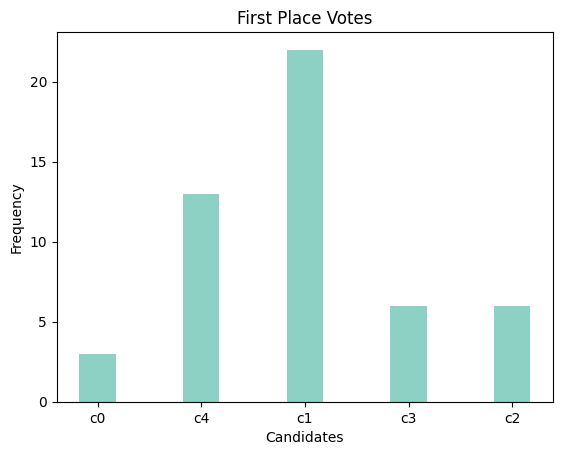
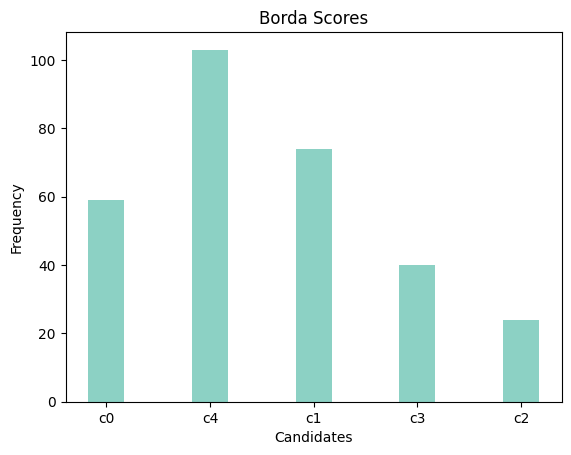
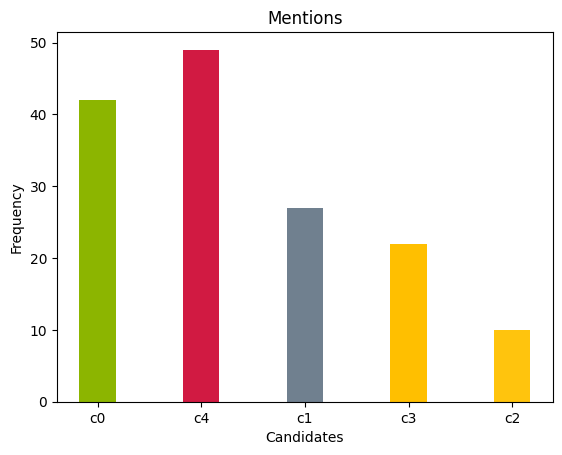
Figure 3: Description of voting results
From the results, we observe that candidate c1 receives the highest number of first-place votes, while candidate c4 scores best in terms of Borda scores and mentions, indicating a high ranking by most voters within their top three preferences.
Voting Mechanisms
Introduction
Random Dictatorship:
Random dictatorship is a simple randomized mechanism that selects a voter uniformly at random and outputs their top choice as the winner. It has been shown to achieve a distortion of strictly less than 3 while requiring only the top choice from each voter, resulting in low sample complexity.
Proportional to Squares:
This voting mechanism is particularly intriguing as it adjusts the selection probability of a candidate based on the square of the number of voters who rank the candidate as their top choice. Formally, for each candidate $x$, let $n_x$ represent the number of voters who rank $x$ as their top choice. The candidate $x$ is then selected with a probability proportional to $\frac{n_x^2}{\sum_y n_y^2}$, where the sum is taken over all candidates $y$.
The key idea behind squaring the counts is to magnify the advantage of candidates who are already preferred by more voters, effectively increasing their chances of winning disproportionately more than their raw popularity might suggest. This approach enhances the lead of candidates who are front-runners, making it more likely for a candidate with significant initial support to be chosen as the winner.
This mechanism tends to emphasize the preferences of the majority, thereby reducing the likelihood of selecting a candidate with only marginal support. It is particularly effective in elections with a small number of candidates (e.g., $m \leq 4$). Under these conditions, the mechanism has shown to perform well in terms of minimizing distortion, which is the discrepancy between the chosen winner and the ideal winner based on collective preferences. By focusing on top choices and reinforcing the weight of these choices, the mechanism aligns closely with majority preference, which is a desirable property in many voting contexts.
Kempe’s Combined Mechanism:
Kempe3 introduces a randomized mechanism that combines random dictatorship and proportional to squares. With probability $\frac{1}{n-1}$, it uses proportional to squares, and with probability $\frac{n-2}{n-1}$, it uses random dictatorship.
Kempe’s motivation for developing this combined mechanism stems from the need to minimize distortion while simplifying the communication requirements in voting systems. This mechanism achieves an optimal distortion of exactly $3 - \frac{2}{n}$ while requiring only the top choice from each voter, resulting in low sample complexity.
While Random Dictatorship is straightforward and minimizes complexity by focusing solely on the choice of a random voter, it can sometimes be too simplistic and not reflective of the broader electorate’s preferences. On the other hand, Proportional to Squares gives more weight to popular candidates but can magnify the majority preference excessively. Kempe’s mechanism balances these tendencies, ensuring that the selection process is neither too biased towards the majority nor too random, thus maintaining fairness and representativeness in the electoral outcomes.
2-Agree Mechanism:
The 2-Agree mechanism, introduced by Gross et al.4, is a simple randomized mechanism that aims to achieve low distortion and low sample complexity. It works by repeatedly sampling voters uniformly at random and asking for their top choice until two voters agree on the same alternative, at which point that alternative is selected as the winner.
Despite its simplicity, 2-Agree achieves almost optimal distortion for a small number of alternatives ($3 \leq m \leq 6$) and satisfies desirable properties such as anonymity, neutrality, and ex-post Pareto efficiency. Additionally, it is shown to perform well in settings with decisive voters, where voters have a strong preference for their top choice compared to other alternatives.
Example
To get a more intuitive understanding of these voting mechanisms, we conducted 1000 simulated elections using previously generated data. We then calculated the distribution proportions for each mechanism. The summarized results are presented in Figure 4.
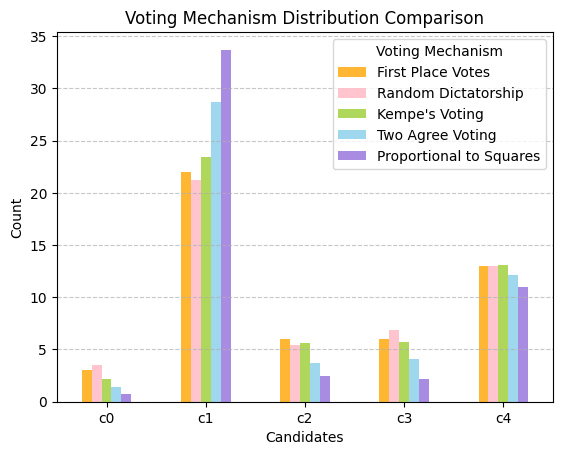 Figure 4: Comparison of voting mechanisms
Proportional to Squares squares the number of first-place votes each candidate receives before calculating proportions. It tends to amplify the preferences of the majority. This method can significantly favor more popular candidates, potentially at the expense of minority voices.
Random Dictatorship randomly selects a single voter and elects their top choice. It treats each voter’s preference equally, giving every voter a potentially equal impact on the outcome, so the probability is close to first-place votes.
Kempe’s Voting is a hybrid approach, combining the principles of Random Dictatorship and Proportional to Squares. This combination can mitigate the extremity of these two methods, aiming for a balance between amplifying majority preference and maintaining equal voter influence.
Two Agree Voting continues sampling voters until two voters agree on a top choice, which then wins. It ensures some level of consensus but may favor the preferences of the majority.
More General Simulation Setup
In this section, we conducted a series of simulations to evaluate the distortion across various voting methods, considering different numbers of voters and candidates. The ranking and distortion of candidates depend on the distance between voters and candidates; thus, the positioning of candidates can significantly affect the outcomes of first place votes. Since all randomized voting mechanisms only consider first choice, if candidates are positioned closely, the voting algorithms may yield similar and distorted results. In this case, we sampled multiple times to ensure robustness of the results.
Figure 5 and 6 illustrates how the proximity of candidates – whether near or far – impacts these outcomes.
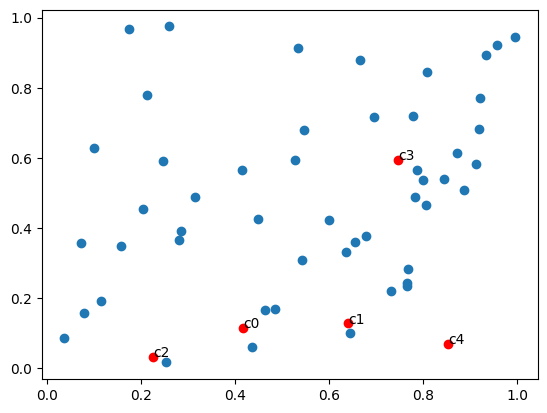
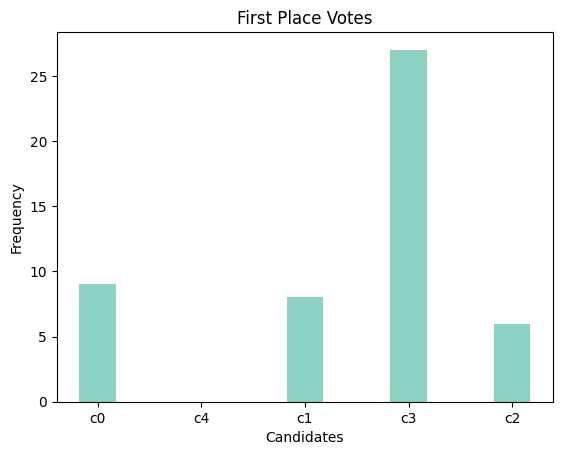
Figure 5: Clustered candidates
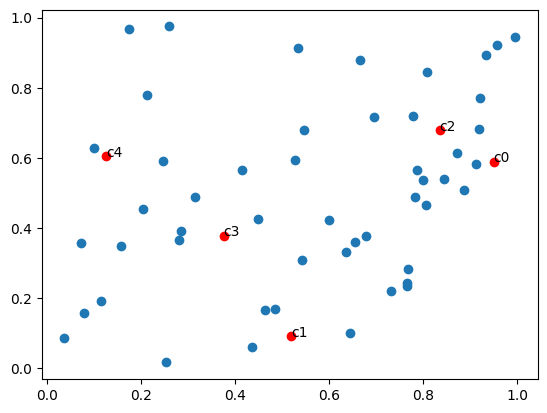
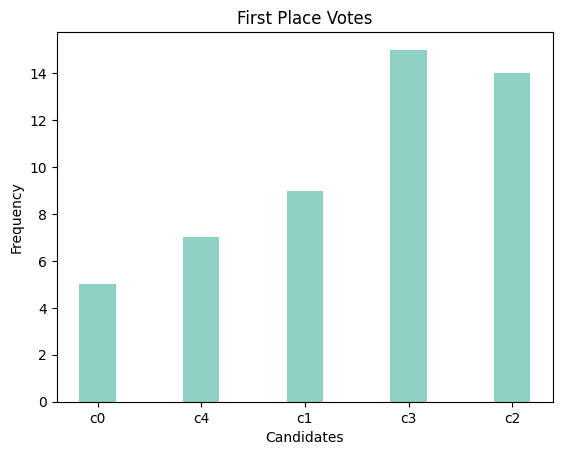
Figure 6: Distant candidates
Simulation Parameters
The simulation parameters were carefully chosen to explore a range of scenarios that could potentially affect the outcomes of different voting methods. The number of voters was incrementally varied from 1000 to 1500, with each step increasing by 100 voters. Simultaneously, the number of candidates was varied from 3 to 11 to test the scalability and robustness of the voting methods under different levels of candidate competition.
Procedure
The simulations followed a structured procedure, outlined in three major steps:
-
Data Generation: Randomly generated positions for each voter and candidate were created to simulate diverse preference scenarios.
-
Election Simulations: For each combination of voters and candidates, the election process was simulated 500 times for each voting method to account for statistical variability and ensure robustness of the results.
-
Distortion Calculation: The distortion, which quantifies the inefficiency of a voting method in reflecting collective preferences, was calculated after determining the winner in each trial.
Pseudocode
Below is the pseudocode representing the algorithm used for the simulations:
Generate random coordinates for *voter_count* voters
    Generate random coordinates for *candidate_count* candidates
    Record coordinates
    Elect winner using specified voting mechanism
    Calculate and record distortion
Overview of Results
The results of the voting mechanism simulations are visualized in two key figures, which depict the frequency of each candidate being elected across different voting mechanisms and the relative effectiveness of these mechanisms by candidate rank.
Candidate Frequency by Voting Mechanism
Figure 7 illustrates the frequency with which each candidate was elected across different voting mechanisms, with the x-axis representing the number of candidates in each simulation, and the y-axis representing the ranking of candidates based on their distortion, with 1 being the optimal candidate and higher numbers indicating candidates with increasingly higher distortion.
The size of the bubble corresponds to the number of simulations in which a particular candidate was selected. This figure demonstrates variability in candidate selection frequency, with larger bubbles indicating a higher selection rate under certain conditions.
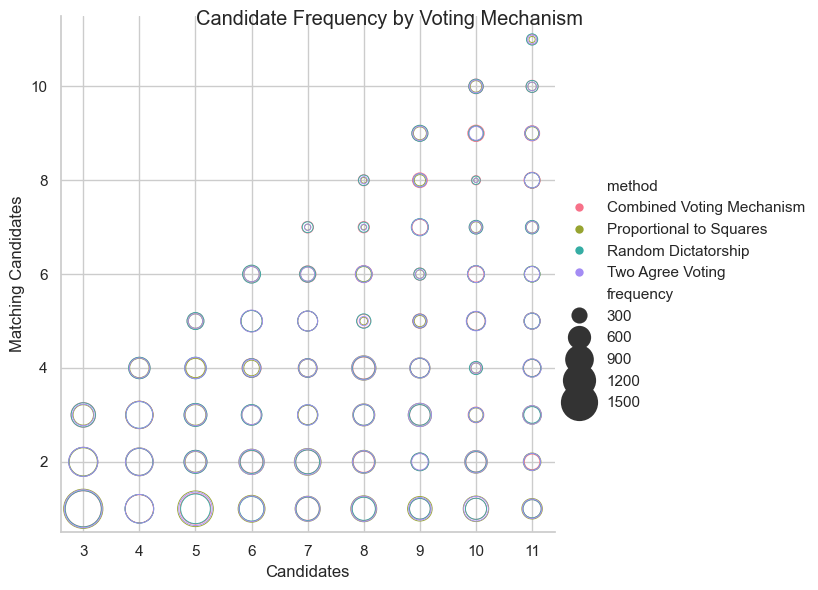
Figure 7: Candidate Frequency by Voting Mechanism
Voting Mechanism Effectiveness by Candidate Rank
Figure 8 standardized the distribution, made the result more intuitive.
The x-axis represents the number of candidates, while the y-axis represents the ranks of candidates. Larger bubbles indicate a higher effectiveness of the algorithm in selecting the optimal candidate with minimal distortion.
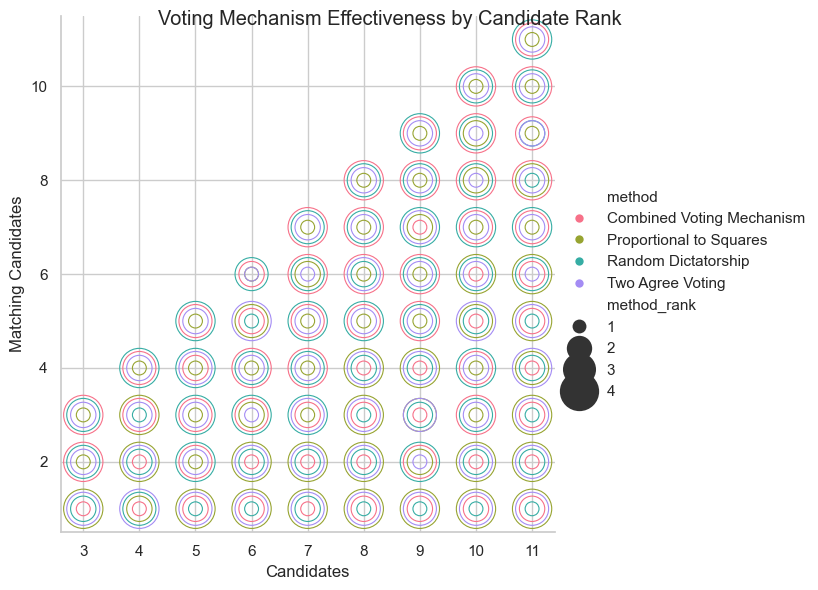
Figure 8: Voting Mechanism Effectiveness by Candidate Rank
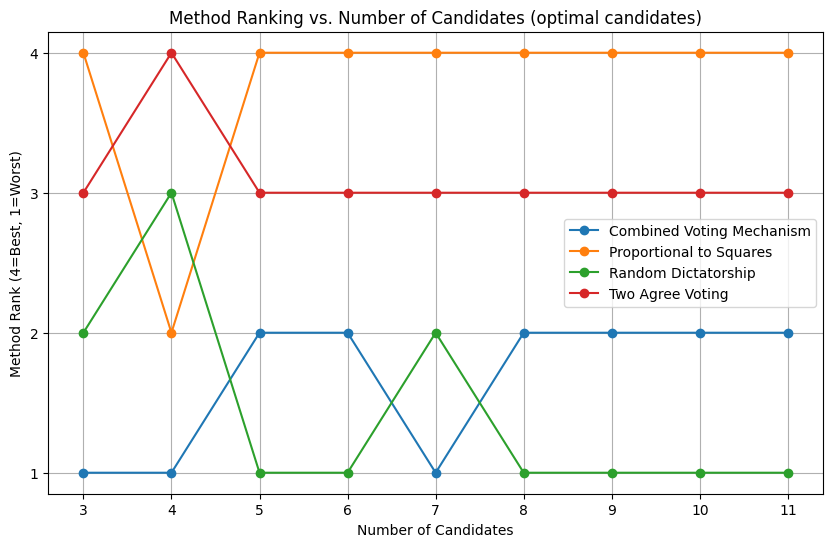
Figure 9: Voting Mechanism Performance in Selecting Optimal Candidate
Figure 9 shows the ranking of these voting methods in selecting the optimal candidate (rank = 1) as the number of candidates varies from 3 to 11. The y-axis represents the ranking of each voting method, with higher numbers indicating better performance in selecting the optimal candidate.
Proportional to Squares consistently performs well. It is the best-performing method for 5 to 11 candidates. The Two Agree Voting method also performs strongly, with rankings mostly between 4 and 3, and it is the best-performing method for 4 candidates.
Random Dictatorship and Kempe’s Combined Voting Mechanism exhibit similar patterns, with rankings mostly between 1 and 2, indicating that they are the worst-performing methods for selecting the optimal candidate across different numbers of candidates.
Discussion
The strong performance of Proportional to Squares can be attributed to its ability to give more weight to candidates with a higher proportion of top-choice votes. As the number of candidates increases, this method becomes more effective at identifying the optimal candidate, as it can better differentiate between the popular and less popular choices.
The Two Agree Voting method’s good performance, particularly for a smaller number of candidates, can be explained by its requirement for agreement between two randomly selected voters. When the number of candidates is small, the probability of two voters agreeing on the same candidate is higher, making it more likely for this method to select the optimal candidate.
The weaker performance of Random Dictatorship and Kempe’s Combined Voting Mechanism suggests that these methods may not be as effective at identifying the optimal candidate. Random Dictatorship’s reliance on a single randomly selected voter may not always capture the overall group’s preferences, especially when the number of candidates is large. Kempe’s Combined Voting Mechanism’s performance indicates that combining Random Dictatorship and Proportional to Squares do improve the selection process, but it may not be as effective as Proportional to Squares alone.
Conclusion
The simulation results generally align with the theoretical expectations of the voting mechanisms. Proportional to Squares consistently performs well in selecting the optimal candidate, particularly as the number of candidates increases. This can be attributed to its ability to amplify the preferences of the majority, effectively differentiating between popular and less popular choices.
Random Dictatorship, which reflects the preferences of every voter equally, may not always lead to the selection of the optimal candidate. This suggests that relying on a single randomly selected voter’s preference may not adequately capture the overall group’s preferences, especially when the number of candidates is large.
Kempe’s Combined Voting Mechanism, which combines Random Dictatorship and Proportional to Squares, does not necessarily lead to better outcomes in terms of selecting the optimal candidate compared to the individual methods. This suggests that the combination of these two methods may not effectively leverage their strengths to improve the selection process.
The Two Agree Voting method, which requires agreement between two randomly selected voters, performs strongly, especially for a smaller number of candidates. This indicates that the method is effective in selecting the optimal candidate when the probability of two voters agreeing on the same candidate is higher.
However, it is important to note that this experiment is limited in scope, as it only considers the first-place votes of each voter. In practice, voters may have more nuanced preferences that could be better captured by considering additional rankings. Incorporating more detailed preferences into the voting mechanisms could potentially impact the distortion and effectiveness of the selection process.
Moreover, the accuracy of the results could be improved by increasing the number of simulations performed for each combination of voters and candidates. This would provide a more robust assessment of the voting mechanisms’ performance.
Future research could explore the impact of incorporating more detailed voter preferences into the voting mechanisms and investigate how this affects the distortion and effectiveness of the selection process. Additionally, conducting experiments with a larger number of simulations and a wider range of candidate and voter configurations could provide further insights into the performance of these voting mechanisms in various scenarios.
-
Condorcet, M. de. (1785). Essai sur l’application de l’analyse à la probabilité des décisions rendues à la pluralité des voix. Imprimerie Royale. https://gallica.bnf.fr/Catalogue/noticesInd/FRBNF37237493.htm ↩
-
Borda, J-C de. (1784). Mémoire sur les élections par scrutin. Histoires et Mémoires de l’Académie royale des sciences, Année 1781, 657–665. Baudouin, Imprimeur de l’Institut National. ↩
-
Kempe, D. (2019). Communication, distortion, and randomness in metric voting. arXiv. https://arxiv.org/abs/1911.08129 ↩ ↩2
-
Gross, S., Anshelevich, E., & Xia, L. (2017). Vote until two of you agree: Mechanisms with small distortion and sample complexity. In Proceedings of the AAAI Conference on Artificial Intelligence (Vol. 31, No. 1). ↩